Of That

Brandt Redd on Education, Technology, Energy, and Trust

11 November 2020

"Quality Assessment Part 10: Scoring Tests"

This is the last of a 10-part series on building high-quality assessments.

A paper with a pencil and some writing.

Lillian takes an exam and gets a score of 83%. Roberta takes an exam and achieves 95%. Are these comparable scores? A fraction of what was achieved in each case?

Suppose Lillian's exam was the final in College Thermodynamics. A score of 83% means that she earned 83% of the maximum possible score on the test. In traditional scoring, teachers assign a certain number of points to each question. A correct answer earns the student all points on that question. Incorrect earns zero points. And a partly correct answer may earn partial points.

Roberta's exam was in middle school Algebra. Like Lillian, her score is represented as a fraction of what can be achieved on that particular exam. Since these are different exams in different subject areas and different difficulty levels, comparing the scores isn't very meaningful. All you can say is that each student did well in her respective subject.

Standardized Scoring for Quality Assessment

This post is a long overdue coda to my series on quality assessment. In part 4 of the series, I introduced item response theory (IRT) and how items can be calibrated on a continuous difficulty scale. In part 6 I described how standardized test scores are mapped to a continuous scale and interpreted accordingly.

This post is a bridge between the two. How do you compute a test score from a calibrated set of IRT questions and put it on that continuous scale?

Calibrated Questions

As described in part 4, a calibrated question has three parameters. Parameter a represents discrimination, parameter b represents difficulty, and parameter c represents the probability of getting the question right by guessing.

Consider a hypothetical test composed of five questions, lettered V, W, X, Y, and Z. Here are the IRT parameters:

ItemVWXYZ
a1.70.91.82.01.2
b-1.9-0.60.00.91.8
c0.00.20.10.20.0

Here are the five IRT graphs plotted together:

Five S curves plotted on a graph with vertical range from 0 to 1.

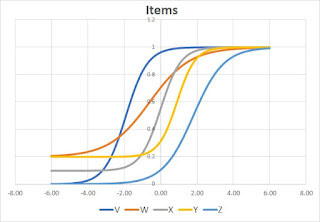
The horizontal dimension is the skill level on what psychometricians call the "Theta" scale. The usable portion is from approximately -3 to +3. The vertical dimension represents the probability that a student of that skill level will answer the question correctly.

All of the graphs in this post, and the calculations that produce them are in an Excel spreadsheet. You can download it from here and experiment with your own scenarios.

Adding Item Scores

When the test is administered, the items would probably be delivered in an arbitrary order. In this narrative, however, I have sorted them from least to most difficult.

For our first illustration the student answers V, W, and X correctly, and they answer Y and Z incorrectly. For answers they get correct, we plot the curve directly. For answers they get incorrect, we plot (1 - y) which inverts the curve. Here's the result for this example.

Three S curves and two inverted S curves plotted on a graph with vertical range from 0 to 1.

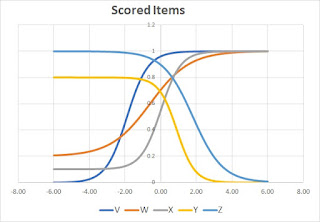
Now, we multiply the values of the curves together to produce the test score curve.

A bell-shaped curve with the peak at 0.4

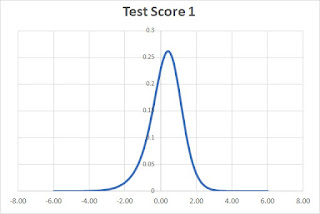
The peak of the curve is at 0.4 (as calculated by the spreadsheet). This is the student's Theta Score for the whole test.

Scale Scores

As mentioned before, the Theta Score is on an arbitrary scale of roughly -3 to +3. But that scale can be confusing or even troubling to those not versed in psychometrics. A negative score could represent excellent performance but, to a lay person, it doesn't look good.

To make scores more relatable, we convert the Theta Score to a Scale Score. Scale scores are also on an arbitrary scale. For example, the ACT test is mapped to a scale from 1 to 36. SAT is on a scale from 400 to 1600 and the Smarter Balanced tests are on a scale from 2000 to 3000.

For this hypothetical test we decide the scale score should range from 1200 to 1800. We do this by multiplying the Theta Score by 100 and adding 1500. We describe this as having a scaling function with slope of 100 and intercept of 1500.

In this illustration, the Theta Score of 0.4 results in a scale score if 1540.

Another Example

We have another student that's less consistent with their answers. They get questions X and Z correct and all others incorrect.

A bell-shaped curve with the peak at -0.6 and wider than the previous curve.

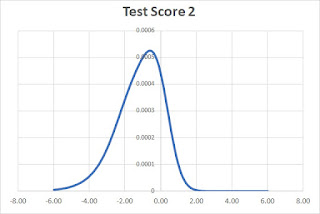
In this case, the peak is at -0.6 which results in a scale score of 1440.

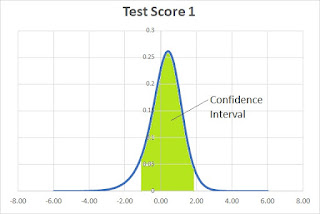
Confidence Interval - Standard Error

In addition to a Scale Score, most tests report a confidence interval. No test is a perfect measure of a student's true skill level. The confidence interval is the range of scores in which the student's true skill level should lie. For this hypothetical test we will use a 90% interval which means there is a 90% probability that the student's true skill level lies within the interval.

To calculate the confidence interval, we take the area under the curve. Then, starting at the maximum point, which is the score, we move outward until we get an area that is 90% of the full area under the curve. The interval is always centered on the peak.

To convert the low and high points of the confidence interval from a Theta scale to a Scale Score scale, you use the same slope and intercept as used before.

We will illustrate this with the results of the first test. Recall that it has a score of 0.4. The confidence interval is from -1.08 to 1.48. The Scale Score is 1540 with a confidence interval from 1392 to 1688.

The difference between the top or bottom of the interval and the score is the standard error. In this case, the standard error of the Theta core is 1.48 and the standard error of the scale score is 148. Notice that scale score standard error is Theta standard error times the slope from the conversion function; 100 in this case.

A bell-shaped curve with the peak at 0.4 with a shaded confidence interval.

The second test result has a Theta Score of -0.6 and a confidence interval from -2.87 to 1.67 (Standard Error ±2.27). The Scale Score is 1440 with a confidence interval from 1213 to 1667 (Standard Error ±227).

A bell-shaped curve with the peak at -0.6 with a shaded confidence interval.

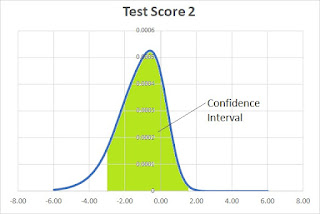
The second student answered harder questions correctly while missing easier questions. Intuitively this should lead to less confidence in the resulting score and that is confirmed by the broader confidence interval (larger standard error).

Disadvantages and Advantages to IRT Test Scoring

IRT Test Scoring is complicated to perform, to explain, and to understand. The math requires numerical methods that are impractical without computers.

Perhaps the biggest weakness is that this form of scoring works best when questions span a broad range of skill levels. That makes it less suitable for mastery assessment which benefits more from a threshold test.

For achievement testing, there are important advantages. Multiple tests can be calibrated to the same scale, supporting the measurement of growth year over year. Calibration of assessment items ensures that scores of different student cohorts are comparable even as the test itself is updated with new questions. And the scoring system is compatible with computer adaptive testing.

Wrapup

Next time you encounter a standardized test score you'll have a better idea of how it was calculated. And, hopefully that will give you a better understanding of how to interpret the score and what to do with it.

There are many types of assessment and corresponding ways to score them. Overall, it's important ensure that the form of testing and scoring is well-suited to the way the results will be interpreted and applied.

References

08 May 2020

Did Blended Learning Save My Class from Coronavirus?

A Blender with a Coronavirus Inside

Last week I turned in final grades from teaching my first-ever college course. In December I agreed to teach one section of Information Systems 201 at Brigham Young University. I've been talking and writing about learning technology for a long time; I was overdue for some first-hand experience. Little did I know what an experience we were in for.

The outbreak COVID-19 forced me, along with hundreds of thousands of other professors, to shift teaching to 100% online. The amazing part is how well it worked out.

About the Class

IS201 is required of all undergraduate business school majors at BYU. Nearly 800 took it Winter Semester. Mine was an evening section composed of 75 students. A handful dropped before the deadline. The other 68 stuck with me to the end. Majors in my class included Accounting, Marketing, Entrepreneurship, Management, Finance, Information Systems and a bunch of others. So, this was a very technical class taught to mostly less-technical majors.

The class starts with an lightweight introduction to Information Systems before diving into four technical subjects. First up was databases. We learned how to design a database using ER Diagrams and how to perform queries in SQL. For that segment, Data.world was our platform. Next up was procedural programming. We used Visual Basic for Applications to manipulate Microsoft Excel spreadsheets. We progressed to data analytics and visualization for which we used Tableau and Microsoft Excel. And the final segment was web programming in HTML and CSS.

Blended Learning

My class was blended from the beginning, which turned out to be quite valuable once Coronavirus hit and Physical Distancing began. As I write this I ponder how freaky it would have been to read those words only three months ago.

The course is standardized across all sections. We have a digital textbook hosted on MyEducator that was developed by a couple of the BYU Information Systems professors. The online materials are rich with both text and video explanations and hands-on exercises for the students. All homework and exams are submitted online and either scored automatically or by a set of TAs. Because the course is challenging, and taken by a lot of students, there is a dedicated lab where students can get TA help pretty much any time during school hours.

The online materials are sufficient that dedicated students can succeed on their own. In fact, an online section relies exclusively on the text and videos (that are available to all) and offers online TA support. Students of that section generally do well. However, they also self-select for the online experience.

So, students of IS 201 have available to them the following blending of learning experiences:

  • Live lectures.
  • Video tutorials. These are focused on a single topic and range from 5 to 25 minutes in length.
  • Written text with diagrams and images.
  • Live TA access.
  • Virtual TA access. Via email and text-chat from the beginning and online web conferencing later.
  • Office hours with the professor.

The assignments on which students are graded are consistent regardless of which learning method they choose. There are a few quizzes but most assignments are project-oriented.

The net result of this is that students are given a set of consistent assignments, mostly project-based, with their choice of a variety of learning opportunities for mastering the material.

Enter Coronavirus

On Thursday, March 12, 2020 BYU faculty and students got word that all classes would be cancelled Friday, Monday, and Tuesday. By Wednesday we should resume with everything entirely online. Students were encouraged to return to their homes in order to increase social distancing. Probably 2/3 of my class did so; one returning home to Korea. Yet, they all persisted. I didn't have any student drop out of the class after the switch to online.

Compared to many of my peers, the conversion was relatively easy. All of the learning materials were already online and students were already expected to submit their assignments online. Despite that, it took me about 10 hours to prepare. I adjusted the due dates for two assignments, scheduled the zoom lessons and posted links in the LMS, sent out communications to the students, and responded to their questions. On Monday I hosted an optional practice class so that I and the handful of students that joined could get practice with the online format.

The department leadership gave me the option of teaching live classes using Zoom or recording my classes for viewing whenever students chose. I elected to teach live but to post recordings of the live lectures.

Thursday, March 19 I posted this on LinkedIn:

Wednesday was the first day of online instruction for Brigham Young University. That day we achieved more than 1,200 online classes, with more than 26,000 participants coming in from 60-plus countries. Not bad, considering we only had five days to prepare, many of the students returned to their homes during the suspension of classes, and we had an #earthquake that morning.

As with the in-person classes, attendance was optional. Attendance dropped from a typical 60 in-person to about 20-25 online. One particularly sunny afternoon I only had seven show up. On average, the recordings had about 30 views each but the last couple, with focus on the final project, had nearly 90 which means some of the students were watching them more than once.

Having worked from home for the last seven years, I have a lot of experience with online videoconferencing. Despite that, I felt a huge loss moving to online classes. I never before realized how much feedback I got from eye contact and facial expressions. In-person, students were more ready to raise their hands or interrupt with questions. Online, I often felt like I was talking to empty space. I had to be very deliberate in seeking feedback. Maintaining long pauses when prompting for questions, encouraging them to post in the chat box, and suggesting questions of my own.

About two weeks into the online mode, I read an article that said there should be at least three live interactions per online class. They can be simple polls, a question to the students for which they are to call out or write a response, or a simple thumbs up or thumbs down on how well they are understanding the material. Zoom, like most other systems, has tools that make this pretty easy. And I found that the advice was good. Engagement really improved when I added even one or two interactions.

The biggest change was with the TA labs. The two TAs that served my class had to move their sessions online, again using Zoom and screen-sharing to support the students. They did an excellent job and I'm enormously grateful. My office hours were also virtually hosted. But, to my surprise, I only had three students make use of that in the online portion of the semester.

A Teaching Opportunity

COVID-19 became a threat to the U.S. just as my class was getting into the unit on Data Analytics. I wrote a little program in C# to download the virus data from Johns Hopkins University and reformat it into a table more suitable for analysis with Microsoft Excel or Tableau. On this webpage I posted links to the data, to the downloader program, and getting started videos for doing the analysis.

Graph of US Coronairus Cases

Wherever possible, throughout that unit, I used the COVID-19 data for my in-class examples. It turned out to be an excellent opportunity to show the strength of proper visualization with real-world data. I also showed examples of how rendering correct data in the wrong way can be misleading. Feedback from the students was very positive though it was sobering when we analyzed death rates.

Saved by Blended Learning

There are many models for blended learning. My class started out with a selection of learning modes with students given the freedom to choose among them. The LMS we used gives statistics on the students' modes of learning. Across the class, students only watched 15% of videos to completion. Meanwhile, they read 71% of the reading materials and completed 95% of the assessments. My rough estimate is that about 65% attended or viewed the lectures. I don't have statistics on their use of virtual TA help but I'm sure it was considerable.

This correlates with what I have seen in studies. Video is exciting but most students prefer from reading with still images. That's because they control the pace. Live interactions remain important because a teacher can respond immediately to feedback from the class. Online-live is more challenging because most visual cues are eliminated but there are ways to compensate. Most of them involve deliberate effort on the part of the instructor such as prompting for questions, instant quizzes, votes, and so forth.

Despite the challenges, my class came out with a 3.4 average, considerably better than the expected 3.2. I would love to take credit for that. But I think it has more to do with a subject and format that are well-suited to a blended model, high-quality online materials (prepared by my predecessors), and resilient students who simply hung in there until the end.

14 January 2020

What’s Up in Learning Technology?

A Lighthouse. Image by PIRO4D from Pixabay.

With the turn of the decade I have read a lot of pessimistic articles about education and learning technology. Most start with the lamentation that there has been little overall progress in student achievement over the last couple of decades – which is true, unfortunately. But what they fail to note are the many small and medium scale successes.

Take, for example, Seaford School District in Delaware. The community has been economically challenged since DuPont closed its Nylon plant there. Three of its four elementary schools were among the lowest performing in the state just a few years ago. Starting with a focus on reading, they ensured a growth mindset among the educators, gave them training and support, and deployed data programs to track progress and inform interventions. They drew in experts in learning science to inform their programs and curriculum. The result: the district now matches the state averages in overall performance and the three challenged elementary schools are strongly outperforming the state in reading and mathematics.

My friend, Eileen Lento, calls this a lighthouse because it marks the way toward the learning successes we’re seeking. For sailing ships, you don’t need just one lighthouse. You need a series of them along the coast. And each lighthouse sends out a distinct flash pattern so that navigators can tell which one they are looking at. By watching educational lighthouses, we gain evidence of the learning reforms that will make a real and substantial difference in students’ lives.

What does the evidence say?

Perhaps the most dramatic evidence-based pivot in the last decade has been the Aurora Institute, formerly iNACOL. In 2010 their emphasis was on online learning and virtual schools. But the evidence pointed them toward competency-based learning and so they launched CompetencyWorks; they renamed the symposium; and, ultimately, renamed the whole organization.

Much criticism has been leveled at No Child Left Behind, and its successor, the Every Student Succeeds Act. The beneficial results of these federal interventions are the state standards, which form the foundation of competency-based learning; and consistent annual reports that indicate how well K-12 schools are performing. On the downside, we’ve learned that measuring and reporting performance, by themselves, are not enough to drive improvement.

Learning science has made great gains in general awareness over the last decade. We’ve learned that a growth mindset makes a critical difference in how students respond to feedback and that the form of praise given by teachers and mentors can develop that mindset. We have evidence backing the notion that deliberate practice and feedback are required to develop a new skill. And we’ve gained nuance about Bloom’s Two Sigma Problem – that tutoring must be backed by a mastery-based curriculum and that measures of mastery must be rigorous in order to achieve the two standard deviation gains that Benjamin Bloom observed.

Finally, we’ve learned that the type of instructional materials doesn’t matter nearly as much as how they are used. Video and animation are not significantly better at teaching than still pictures and text. That is, until interactivity and experimentation are added. To those, we must also add individual attention from a teacher, opportunities to practice, and feedback.

Learning Technology Responding to the Challenge

A common realization in this past decade is that technology does not drive learning improvement. Successful initiatives are based on a sound understanding of how students learn best. Then, technology may be deployed that supports the initiative.

A natural indicator of what technology developers are doing is the cross-vendor standards effort. In the last couple of years there has emerged an unprecedented level of cooperation not just between vendors but also between the technology standards groups.

Here’s what’s up:

Learning Engineering

A properly engineered learning experience requires a coalescence of Instructional Design, Learning Science, Data Science, Competency-Based Learning and more. The IEEE Learning Technology Standards Committee (LTSC) has sponsored the Industry Consortium on Learning Engineering (ICICLE) and I’m pleased to be a member. We held our conference on Learning Engineering in May 2019, proceedings are due out in Q1 of 2020, the eight Special Interest Groups (SIGs) meet regularly and we have a monthly community meeting.

Interoperable Learner Records (ILR)

The concept is that every learner (and that’s hopefully everyone) should have a portable record that tracks every skill they have mastered. Such a record would support learning plans and guide career opportunities.

  • The T3 Innovation Network, sponsored by the US Chamber of Commerce Foundation, includes “Open Data Standards” and “Map and Harmonize Data Standards” among their pilot projects. These projects are intended to support use of existing standards rather than develop new ones.
  • Common Education Data Standards (CEDS) define the data elements associated with learner records of all sorts and the various standards initiatives continue to align their data models to CEDS.
  • IMS Global has published the Comprehensive Learner Record (CLR) standard.
  • The PESC Standards define how to transfer student records to, from, and between colleges and universities.
  • The Competency Model for Learning Technology Standards (CM4LTS) study group has been authorized by the IEEE LTSC to document a common conceptual model that will harmonize current and future IEEE LTSC standards. The model is anticipated to be based on CEDS.
  • The Advanced Digital Learning Initiative (ADL) has launched the Total Learning Architecture (TLA) working group seeking to develop “plug and play” interoperability between adaptive instructional systems, intelligent digital tutors, real-time data analytics, and interactive e-books. Essential to the TLA will be a portable learner record that functions across products.
  • The HR Open Standards Consortium defines standards to support human resource management. The standards include competency-oriented job descriptions and experience records.

While these may seem like competing efforts, there is a tremendous amount of cooperation and shared membership across the different groups. In fact, A4L, PESC, and HR Open Standards have established an open sharing and cooperation agreement. Our goal is a complementary and harmonious set of standards.

Competency Frameworks

A Competency Framework is a set of competencies (skills, knowledge, abilities, attitudes, or learning outcomes) organized into a taxonomy. Examples include the Common Core State Standards, Next Generation Science Standards, the Physician Competency Reference Set, the Cisco Networking Academy Curriculum, and the O*Net Spectrum of Occupations. There are hundreds of others. Interoperable Learner Records must reference competency frameworks to represent the competencies in the record.

Learning Resource Metadata

Metadata can indicate that a piece of content (text, audio, video, interactive activity, etc.) is intended to teach or assess a particular competency or set of competencies. So, when a person completes an activity, their interoperable learner record can be updated with evidence that they have learned or are learning those competencies.

Standards Advocacy

All of this interoperability effort will be of little use if the developers of learning activities and tools don’t make use of them.

  • Project Unicorn advocates for U.S. school districts to require interoperability standards from the vendors that supply their educational tools.
  • EdMatrix is my own Directory of Learning Standards. It is intended to help developers of learning tools know what standards are applicable, to help learning institutions know what to seek or require, and to help standards developers know what related efforts are underway and to support cooperation among them.

Looking to a New Decade

It can be discouraging to look back on the last decade or two and compare the tremendous investment society has put into education with the lack of measurable progress in outcomes.

I prefer to look forward and right now I’m optimistic. Here’s why:

Our understanding of learning science has grown. In daily conversation we use terms like “Growth Mindset,” “Competency-Based Learning,” “Practice and Feedback,” and “Motivation”.

Online and Blended Learning, and their cousin, Adaptive Learning Platforms, have progressed from the “Peak of Inflated Expectations” through the “Trough of Disillusionment” (using Gartner Hype Cycle terms) and are on their way to the “Plateau of Productivity.” Along the way we’ve learned that technology must serve a theory of learning not the other way around.

Technology and standards efforts are now spanning from primary, and secondary education, through higher education and into workforce training and lifelong learning. This reflects a rapidly changing demand for skills in the 21st century and a realization that most people will have to retrain 3-4 times during their lifetime. I expect that lasting improvement in postsecondary education and training will be driven by workplace demands and that corresponding updates to primary and secondary education will be driven by the downstream demand of postsecondary.

So, despite a lack of measurable impact in standardized tests, previous efforts have established a foundation of competency standards and measures of success. We have hundreds of “lighthouses” - successful initiatives worthy of imitation. On the foundation of competencies and standards, following the lighthouse guides we will build successful, student-centric learning systems.

What do you think? Are the investments of the last couple of decades finally about to pay off? Let me know in the comments.